4 ETFs with monthly dividend payouts

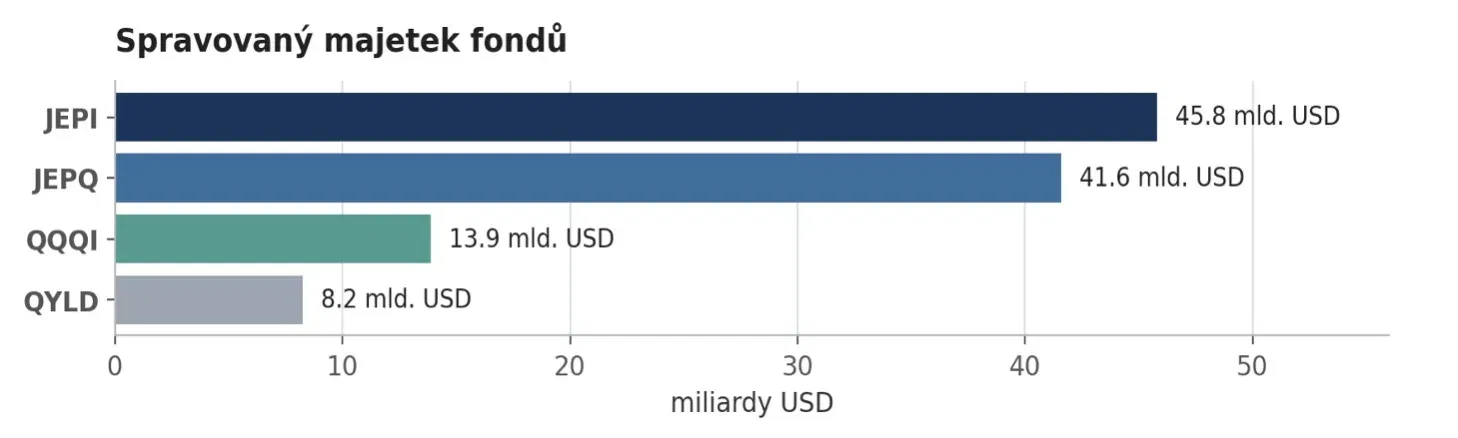
Funds that send money to your account every month have, over the past few years, gone from a fringe curiosity to one of the fastest-growing market segments. The four largest of them now manage combined assets of over 109 billion dollars, roughly 2.3 trillion crowns, and are becoming increasingly popular among investors.

Key points
High monthly yield and high profit are not the same thing. In our analysis on data, we show exactly where these two numbers diverge and why you can't tell from your account statement.
Money that arrives every month isn't necessarily profit. In one payout in this segment, 98% was a return of your own money. The analysis includes a breakdown of how to recognize it.
Wall Street just bought this segment for billions. What exactly do the big banks see in products that promise double-digit income, and what does it hint about who profits from them most reliably.
Twelve years of history reveals what marketing conceals. The longest available time series shows how the annual payout behaves in calm and nervous periods and what it does to the share price.
Complete numbers in one place. Prices, assets, fees, payouts over the last twelve months, long-term performance, risk table, and a model calculation of how much one million crowns would yield monthly. All of this can be found in the analysis.
How serious Wall Street is about these funds was shown on August 12, 2026, by Goldman Sachs. The bank announced it is buying NEOS Investments, the manager behind the QQQI fund, for up to 2.25 billion dollars. A year earlier it bought Innovator for two billion. Combined, the bank moves into the top eight managers of actively managed exchange-traded funds in the world.
This analysis summarizes what the individual funds actually offer: how much a share costs, how much they pay out, how they perform compared to a plain index, and where the hidden compromises are that you make when buying them.
4 funds in one table
Indicator | JEPI | JEPQ | QQQI | QYLD |
Manager | J.P. Morgan | J.P. Morgan | NEOS | Global X |
Fund inception | 5/2020 | 5/2022 | 1/2024 | 12/2013 |
Underlying index | S&P 500 | Nasdaq 100 | Nasdaq 100 | Nasdaq 100 |
Share price | 57.89 USD | 60.42 USD | 55.79 USD | 18.16 USD |
Assets under management | 45.80 bn | 41.58 bn | 13.87 bn | 8.23 bn |
Annual fee | 0.35% | 0.35% | 0.68% | 0.60% |
Payout over 12 months | 4.58 USD | 6.52 USD | 7.62 USD | 2.11 USD |
Distribution yield | 7.91% | 10.80% | 13.67% | 11.62% |
Total return 12 mo. | 11.26% | 21.23% | 19.41% | 21.28% |
Since inception annually | 11.51% | 16.74% | 20.20% | 8.69% |
Beta | 0.54 | 0.84 | 0.94 | 0.61 |
Number of positions | 135 | 110 | 108 | 105 |