The new Fair Price Index shows where the market stands relative to fair value: the whole world, regions, and sectors

A market thermometer, the share of undervalued, fairly valued, and overvalued companies, the distribution of differences between price and value, and sectors ranked from cheapest. The rebuilt Fair Price Index is controlled by a single selection: region, company size, sector, confidence, and score.
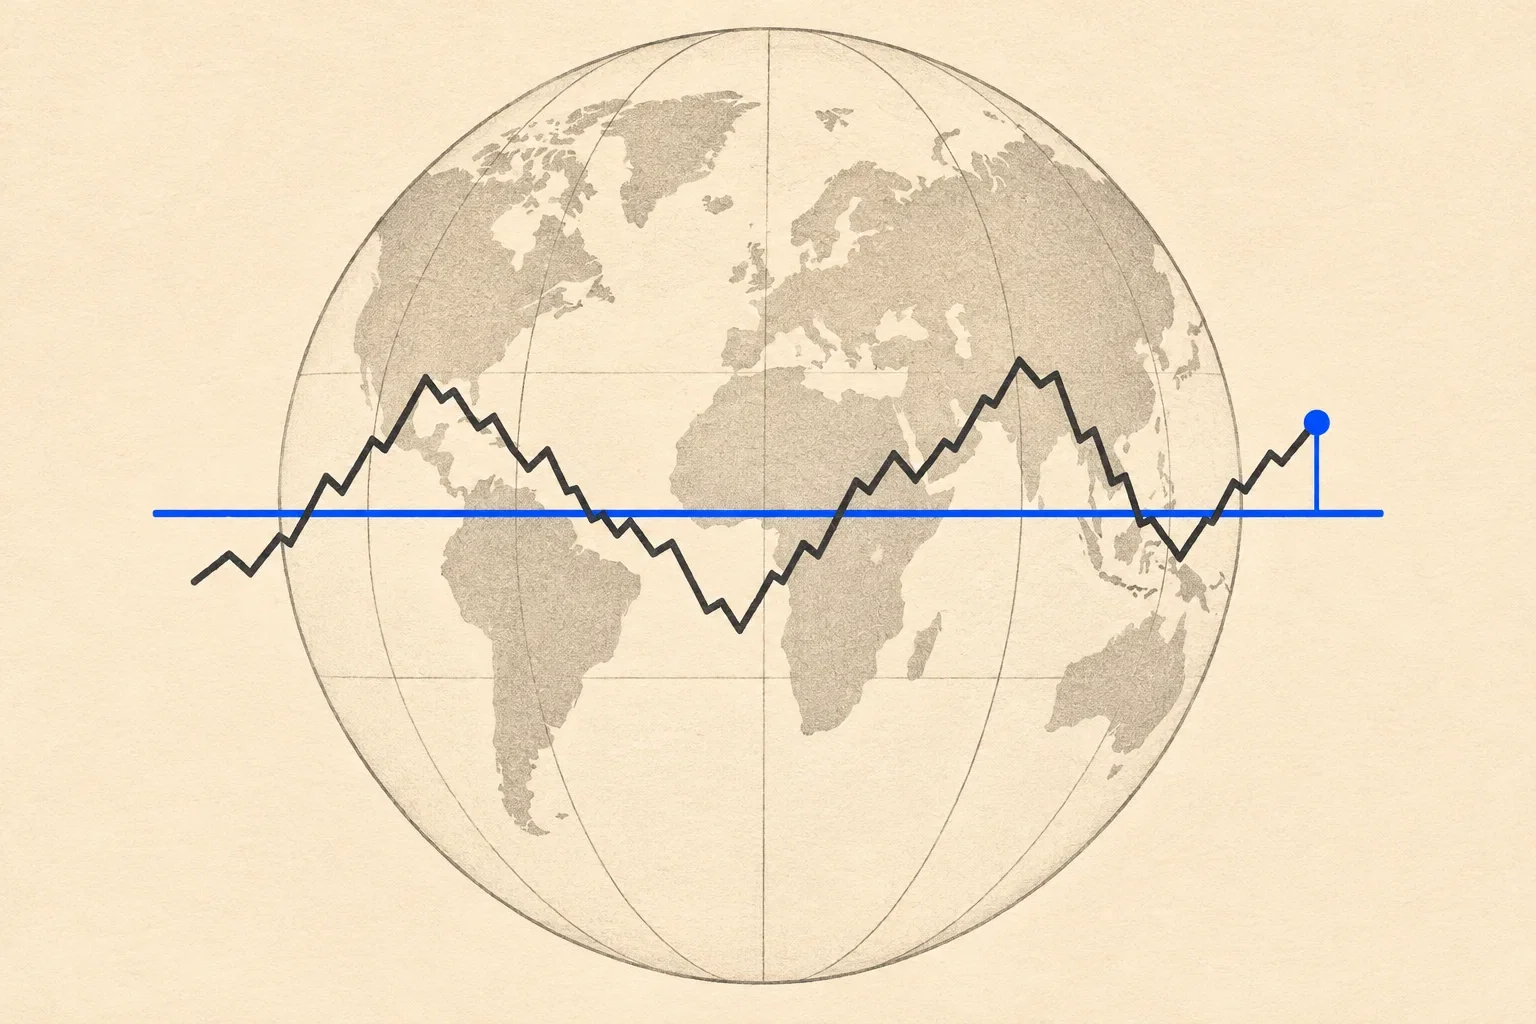
A fair price tells you whether a single stock is expensive or cheap. Put the fair prices of nearly six thousand companies side by side, and you can say the same about the entire market. That's why we rebuilt the Fair Price Index on Bulios. At the top, you'll find one number for the whole market, followed by the share of undervalued, fairly valued, and overvalued companies, the distribution of differences between price and value, and sectors ranked from cheapest. The entire page is controlled by one selection: region, company size, sector, confidence in the valuation, and score. Below the overview is a list of companies that you can sort by how far the price is from fair value.
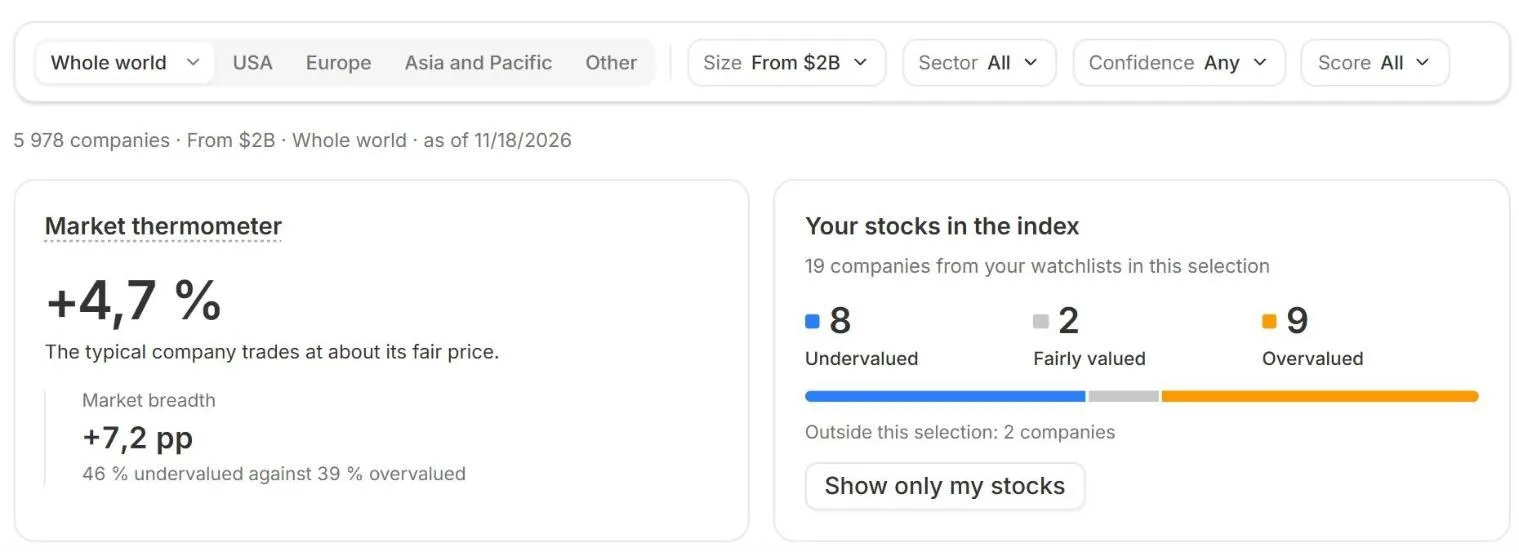
Fair Price Index as of 18. 11. 2026: selection at the top, Market Thermometer, and stocks from your watchlists.
Market Thermometer: one number for the whole market
The Market Thermometer is the median difference between Bulios Fair Price and today's price. Half of the companies in the selection have a larger difference, and half have a smaller one. As of 18. 11. 2026, it stood at +4,7 % for 5 978 companies worldwide with a market capitalization of at least 2 billion dollars. A positive number means a typical company is trading below its fair value; a negative one means it is trading above it. A difference of up to 10 % in either direction counts as a fair valuation, so the thermometer indicates that a typical company is trading at roughly fair value. Next to it is market breadth, meaning the share of undervalued companies minus the share of overvalued ones. As of 18. 11., it came to +7,2 points, so there were more undervalued companies. Once you log in, you'll also see your stocks on the right: how many companies in your watchlists are undervalued, fairly valued, and overvalued.
What the Fair Price Index shows
- Market Thermometer. The median difference between fair price and today's price for companies in the selection.
- Market breadth. By how many points undervalued companies outnumber overvalued ones.
- Three verdicts. The share of undervalued, fairly valued, and overvalued companies, including confidence in the valuation.
- Distribution. How far prices are from fair value, across seven ranges.
- Sectors. Eleven sectors ranked from cheapest.
- Your stocks. Where companies in your watchlists stand relative to fair price.
How many companies are cheap, and how far are their prices from fair value?
The Where Prices Stand Relative to Value card shows the market as one hundred squares, one for each percent of companies. Blue squares are undervalued, gray ones fairly valued, and orange ones overvalued. A solid square indicates high confidence in the valuation; a light one indicates medium or low confidence. This lets you see at a glance how many verdicts are based on solid figures. As of 18. 11. 2026, 2 760 companies (46 %) were undervalued, 890 (15 %) fairly valued, and 2 328 (39 %) overvalued. The neighboring card breaks down the same companies by the size of the difference. Each dot represents one percent of companies, the line marks the median, and the bracket below the axis shows the range containing the middle half of companies: from -26 % to +42 %. At the extremes are companies where price and value differ the most. For 1 144 of them, fair price is more than 50 % above today's price.
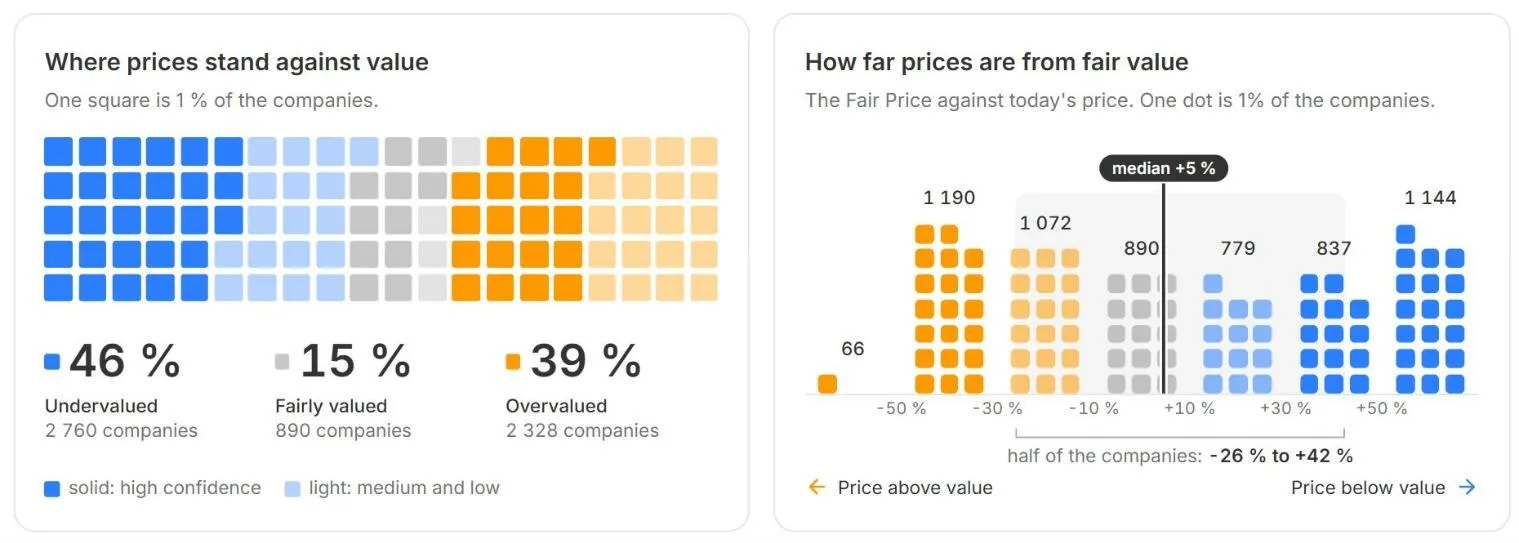
Verdicts shown as one hundred squares and the distribution of differences between price and fair value.
Where the market is cheapest: sectors and regions
The Where the Market Is Cheapest card ranks eleven sectors by the median difference. The dot marks the sector median, and the bar shows the middle half of its companies. As of 18. 11. 2026, energy led at +21 %, followed by consumer discretionary, communication services, and financials at +14 %. At the other end were technology and healthcare at -9 %. A long bar means that companies in the sector vary widely and that the median says little about any individual stock. You can compare regions in the same way. Switch the selection from the whole world to the US, Europe, or Asia Pacific, and the thermometer, verdicts, and sectors will update.
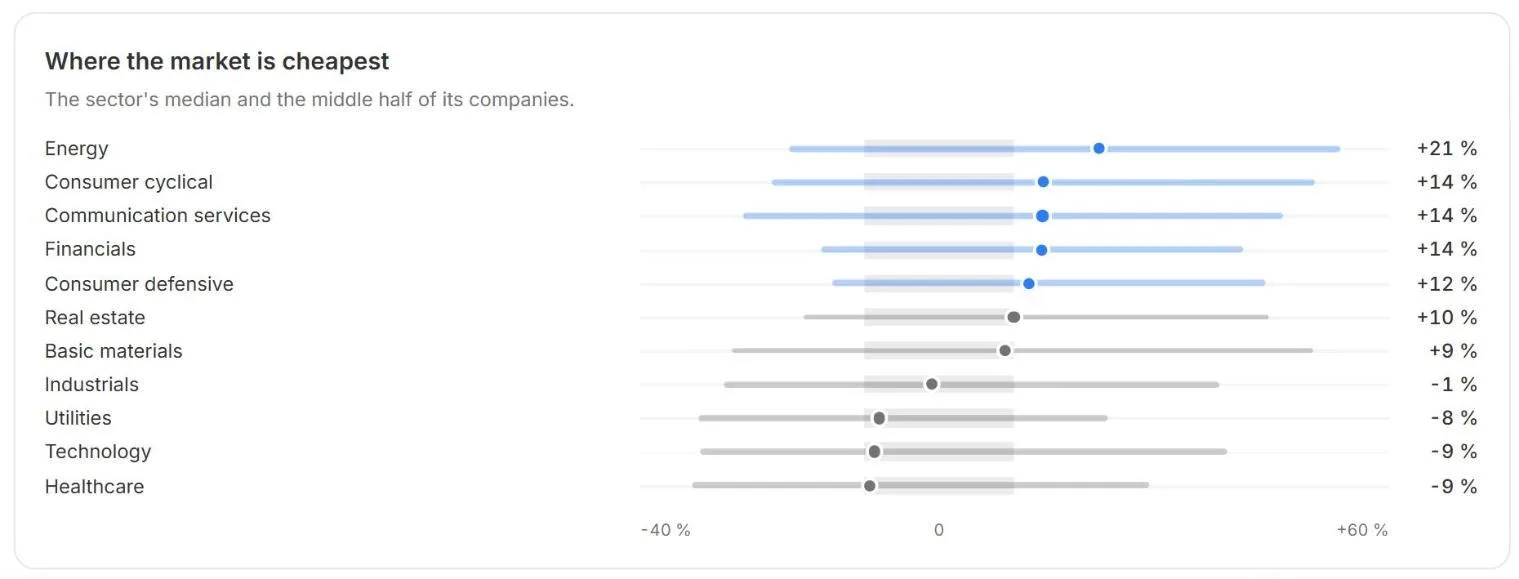
Sectors ranked from cheapest: the median and middle half of companies in each sector.
One selection controls the whole page
The selection bar stays at the top as you scroll and applies to everything below it: the thermometer, cards, and list. You can choose a region, including individual exchanges, company size, sector, confidence in the valuation, and score. By default, the index includes companies with a market capitalization of at least 2 billion dollars, but you can switch to all companies or selected categories. The score consists of six ratings Bulios gives each company: valuation, debt, growth, profitability, quality, and stability. Your selection is saved in the page URL, so you can bookmark it or share it. On your phone, open the same options with a single button.
A list of companies sorted by the difference
Below the overview is a list of the companies in your selection. Each company has one row with today's price, Bulios Fair Price and its range, a price-versus-value scale, the difference in percent, and a verdict. On wider screens, you'll also see market capitalization, confidence, and the six scores. A triangle next to a verdict means there's something to know about the valuation, such as a significant difference between the two calculation methods. Tabs above the list filter it to undervalued, fairly valued, or overvalued companies and show the number in each group. Sort the list by companies trading furthest below fair price, furthest above it, by confidence, or by size. Search for a specific company, show only your stocks with one button, and add a company to your watchlist with the star.
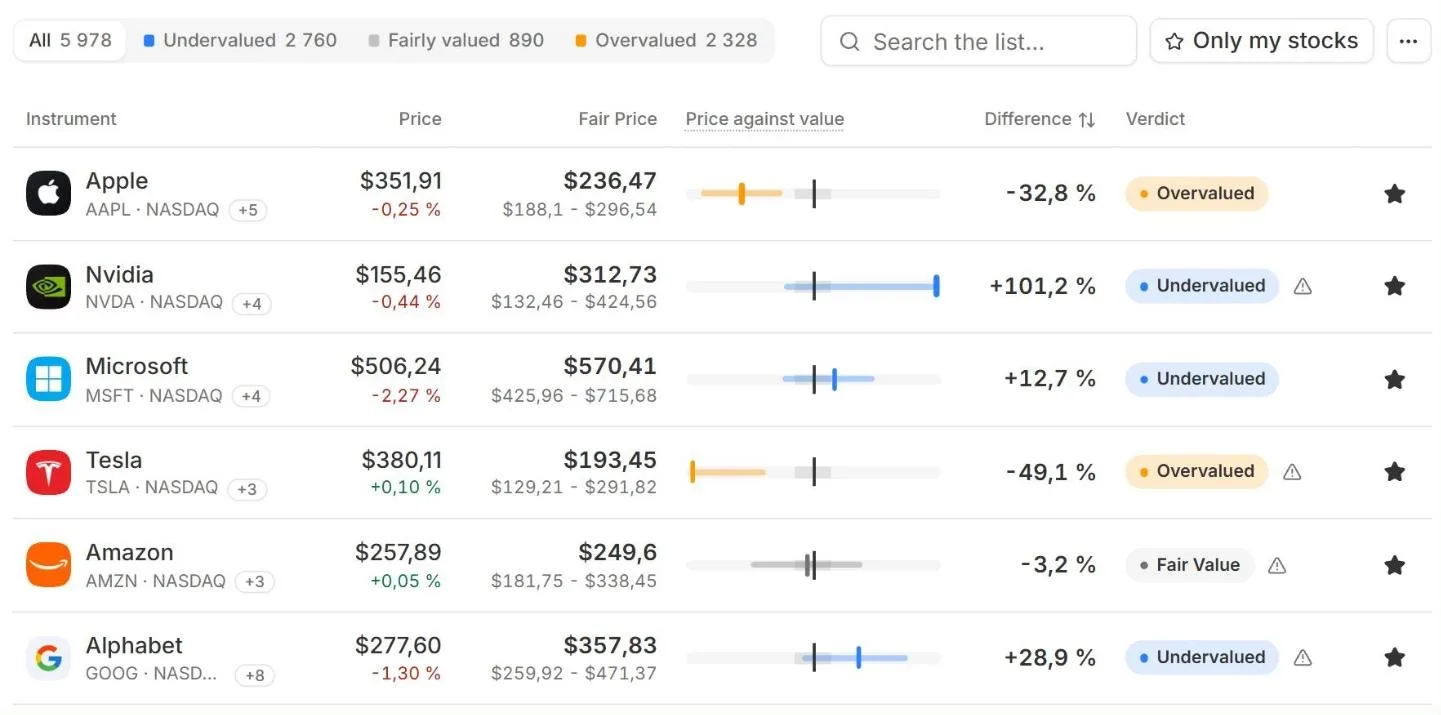
Company list: price, Bulios Fair Price with range, scale, difference, and verdict.
How to use it
1. Go to bulios.com/fair-price-index, or select Fair Price Index from the Tools section of the menu.
2. Choose a region and company size in the bar at the top. The whole page will update.
3. Read the thermometer, share of verdicts, and sector rankings on the cards.
4. Sort companies in the list by difference, and add the ones you're interested in to your watchlist with the star.
-----
The images in this article show the state as of 18. 11. 2026; prices and figures in them change daily. For some companies, the range through 12. 12. 2026 also includes an earlier Bulios estimate. Bulios Fair Price is an estimate from a valuation model, not investment advice. Always do your own research.